Integrating NCover with TeamCity
Although this article is specific to TeamCity 4.0, this setup works with TeamCity 5.0 as well. Request an article specific to TeamCity 5.0.
This article covers the basics of getting NCover working with an existing TeamCity build setup and assumes you are familiar enough with the TeamCity platform to navigate around without much difficulty. Although it's possible to cram all of the tasks described in this article into a single build configuration, this walkthrough assumes that running NCover (covering the tests) happens in a different build configuration than generating the coverage report. The reasons for this are twofold. First, decoupling the two tasks means that you get faster feedback on the success/failure of your tests, and second, with the reporting task decoupled it can run on a separate machine, create multiple reports, or do complicated merging, filtering, and reporting that would be infeasable (because of time or memory resources) to do in the build configuration that runs the tests.
All of the examples and screens for this article come from setting up our internal NCover project build process on a TeamCity v4.0 server. The NCover build process is broken into three build configurations. The first build configuration is run whenever the NCover source control repository recieves a new checkin. The build configuration checks out a fresh copy of the source, then compiles and builds the entire solution, including documentation, and creates the x86 and x64 installers.
The second build configuration runs once the first one has successfully finished. It takes the compiled assemblies, artifacts from the first build, and runs all the tests with code coverage. If the second build configuration has no failing tests, then the third build configuration takes the coverage files from the second build configuration and creates several reports from them. Those reports are published to the TeamCity web interface so that anyone on the NCover team can see them.
Creating a Build Configuration To Run Tests And NCover
The shortest, most maintainable way to plug NCover and tests into a TeamCity Build Configuration is to add targets to your build script that use the custom NCover build tasks to gather coverage on your project. Adding the targets to your build script lets you keep a log of the changes to the targets (you do keep the build script in source control, right?), and lets anyone gather coverage without having to figure out the right command line arguments.
To make adding NCover tasks to your build script easier, you can develop and configure the task in NCover Explorer, then use the Script Helper to generate a build task for either NAnt or MSBuild, or you can browse the build task documentation and create a task by hand. This is the build target that runs the NCover project's unit tests:
    $(BUILD_NUMBER)
    $(BUILD_NUMBER)
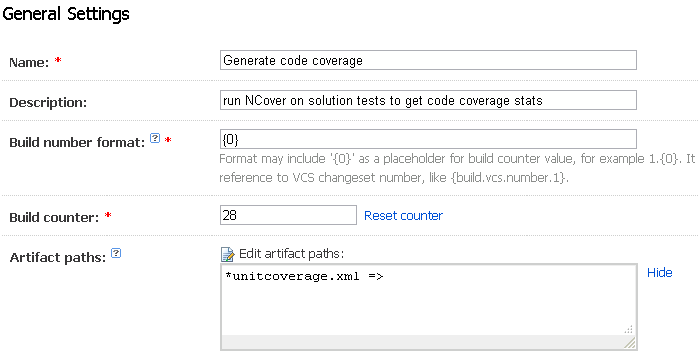
Once the build targets have been created and added to your build script, setting the rest up in TeamCity is easy. Let's assume you called the target "CoverMyCode". Next, you would create a new build configuration and give it some descriptive name. Make sure you preserve the coverage file created by NCover as an artifact, as was done in the screenshot below.
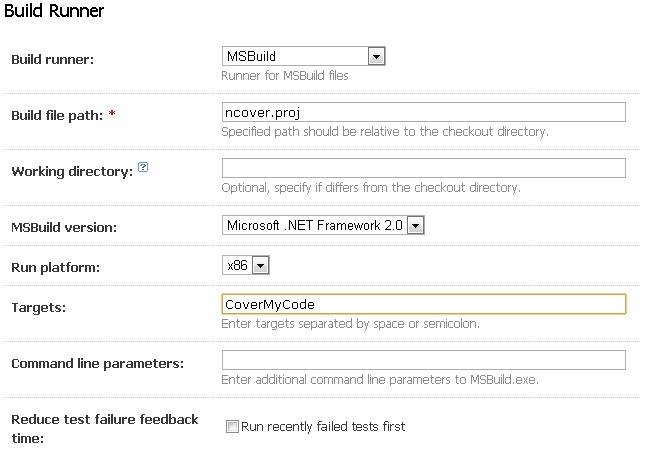
You don't need to attach a version control system root unless you want the checkin number, so go straight to the Choose Build Runner page. On this page you need to set up your build runner. I've used MSBuild here, but TeamCity supports nearly a dozen different build runners so the one you use should be available. Click the Save button. We still have a little way to go in setting up the Build Configuration.
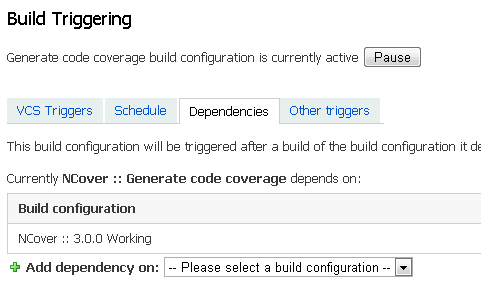
Move to step 4, Build Triggering, and select the Dependancies tab. The tests should only run if the configuration that builds the solution was successful, so add a dependancy on that configuration, as has been done in the screenshot.
This build configuration also needs access to the test assemblies and the solution assemblies that the test assemblies depend on, so move to step 5, Dependancies, and add an artifact dependancy on the build configuration that builds the solution. In the screenshot, I've told Teamcity to get all the artifacts from that configuration and copy them to the base directory of this configuration. Setting it up like this is the easiest way to make sure this configuration has everything it needs to cover your solution, but if the build configuration publishes lots of artifacts, you may need to filter the list down to the essentials.

That's the last setup step for this build configuration. At this point, you should be able to go to the projects page and run the new configuration you just setup! The next step is to create reports from all that coverage data your build task is gathering.
Creating NCover Coverage Reports From TeamCity
Again, the easiest way to set this up is to add targets to your build script that use the custom NCover build tasks to transform NCover coverage files into several reports. Unfortunately, these tasks have to be created and tested manually, since NCover Explorer doesn't understand how to create them (yet). However, you can consult the documentation here and here, and here to help you create the reporting build tasks and help you understand what you can do with the reporting tool. Here is what the example build target looks like:
            SymbolModule
            Html
            .\coverage\symbolmodule.html


            FullCoverageReport
            Html
            .\coverage\full\index.html
Since the NCover summary reports use 3 images when they're created as HTML, it's easier to output the summary reports to a single directory and publish the entire directory as an artifact, especially if you're creating more than one report.
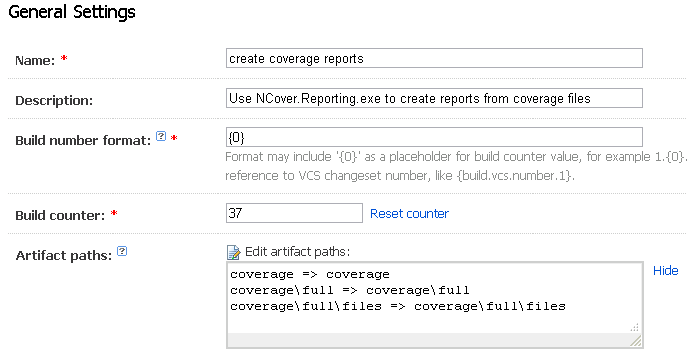
Let's assume the target that creates the NCover reports is called CreateCoverageReports. Once the build targets have been created, you can create a new build configuration in TeamCity to run the target and publish the created reports to TeamCity. Give the new build configuration a descriptive name of some kind, and make sure all the report files that will be created by the configuration are preserved as artifacts. TeamCity can show custom HTML reports rather easily, so unless you have a convincing need for the xml reports, create the HTML versions.
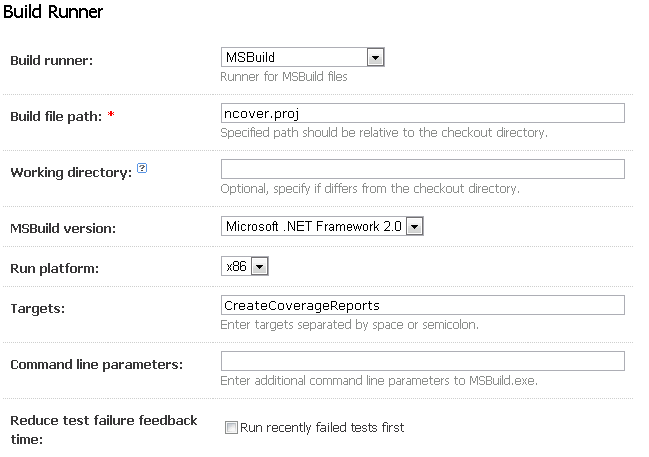
You don't need to attach a VCS root to this build configuration so you can skip that page again. Setting up a build runner should be as easy as setting it up for the code coverage configuration, but make sure to give the build runner the correct target. Click the Save button when you're done, and then move on to step 4, Build Triggering.
The reports should be created after the coverage build configuration has finished, so select the Dependencies tab and make this build configuration dependant on the one that creates the coverage files, which should be the same one that runs your tests. Next, move to step 5, Dependencies, and add an artifact dependency to the configuration that creates the coverage files. You'll have to decide whether you want artifacts from the last successfull build or just the last build, the primary difference being whether you want coverage reports from a build that had failed tests, and hence probably has lower coverage anyway. Also, I've chosen to copy all the artifacts over, you may want to copy a more restrictive list if the coverage configuration makes artifacts of more that coverage files.

That's the last step of this build configuration. At this point, you should be able to run this new build configuration and verify that the reports do get created! The only thing left to do is make the reports easily available through the TeamCity web interface.
Publishing Coverage Reports Through The TeamCity Interface
Once the coverage reports are being created by NCover.Reporting.exe, making them available in the TeamCity interface boils down to publishing them as artifacts and modifying the TeamCity server's main-config.xml as described here. When you modify the main-config.xml, make sure that the Title attribute is unique among the
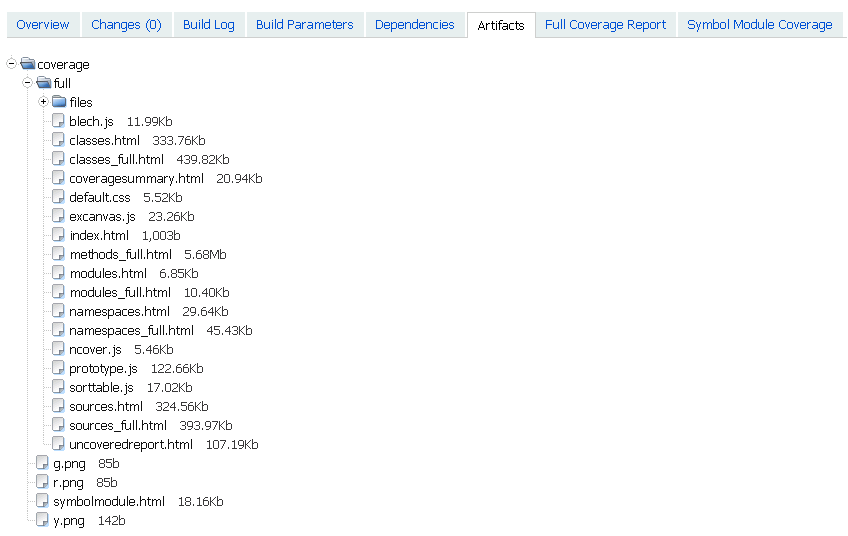
Once Teamcity publishes the reports, you should see two new tabs on the build page, one for each report, and the reports will be available under the Artifacts tab as well.
With TeamCity configured to generate and display code coverage reports, your team is headed down the right path toward improving the quality of their code.